Australian Property Investment Strategy: Income, Not Hope

Investment Solutions
By Paul Ashworth, Managing Partner, Chief Investment Officer David Clark, Deputy Chief Investment Officer
Posted 19 August 2026
  • Long bonds have reclaimed the valuation argument. With the 10-year Commonwealth bond yield close to 5%, many prime property assets offer only a modest headline premium before tax, capital expenditure and illiquidity. Income, not cap-rate compression, must carry the return. 

  • Australia's housing shortage is real, but it is not a guarantee of capital growth. Near-term prices remain governed by borrowing capacity, tax treatment, local supply and the depth of the next buyer pool – as July's broad-based price falls against rising construction costs confirmed. 

    • Sector selection has replaced the market call. Industrial is strong but fully priced; neighbourhood and large-format retail offer credible income growth; living and operational assets are part property, part operating business; and office rewards only a barbell of scarce premium buildings and deeply repriced, fully funded value. 

    • Tax is now part of the value, not a line below it. The 2026 Federal residential reforms divide grandfathered property from later acquisitions, and favourable treatment may not transfer to the next buyer – tax should be a filter, not the investment thesis. 

    • The vehicle changes the risk. A quality asset held through a leveraged, fee-heavy or illiquid structure can become a poor investment. Listed A-REITs transmit long-bond movements quickly, but that repricing also creates entry points that rarely arise in slowly valued private markets. 

  • Portfolio discipline does the compounding work. Count the whole property balance sheet, lifestyle, business and portfolio, separate financial return from lifestyle consumption, hold at least 24 months of downside liquidity, and stress the exit rather than validating the entry. 

  • Income growth, balance-sheet strength and liquidity should drive allocation. The more attractive opportunities tend to sit in assets with rent-reset potential, genuine scarcity and active-management capability, rather than in passive property bought largely in anticipation of lower rates. For our clients, that exposure is gained through listed, managed and syndicate vehicles rather than direct ownership, with listed property at neutral and an expected 7-8% per annum over the decade. 

The easy beta period, when cheap capital and broad scarcity lifted most assets together, has given way to a more selective market. Income quality, balance-sheet resilience, tax status, capital expenditure and exit liquidity now matter more than the label attached to the asset. 

The relevant question is not whether Australian property is attractive in the abstract. It is which assets can grow their income, withstand refinancing, fund their reinvestment requirements and remain liquid when the investor eventually wishes, or needs, to exit. 

At this note's cut-off on 4 August 2026, the RBA cash rate was 4.35%, while the 10-year Commonwealth bond yield was approximately 4.94%. Headline inflation was 3.8% and trimmed-mean inflation 3.6%. 

A long lease with fixed annual reviews may look secure, but the longer and more fixed the income stream, the more the asset begins to behave like a bond, except that it also carries leasing risk, capital expenditure, state taxes, vacancy and illiquidity. 

Bar chart - capital pricing

Figure 1. Property yields remain only modestly above the Commonwealth 10-year bond yield. 

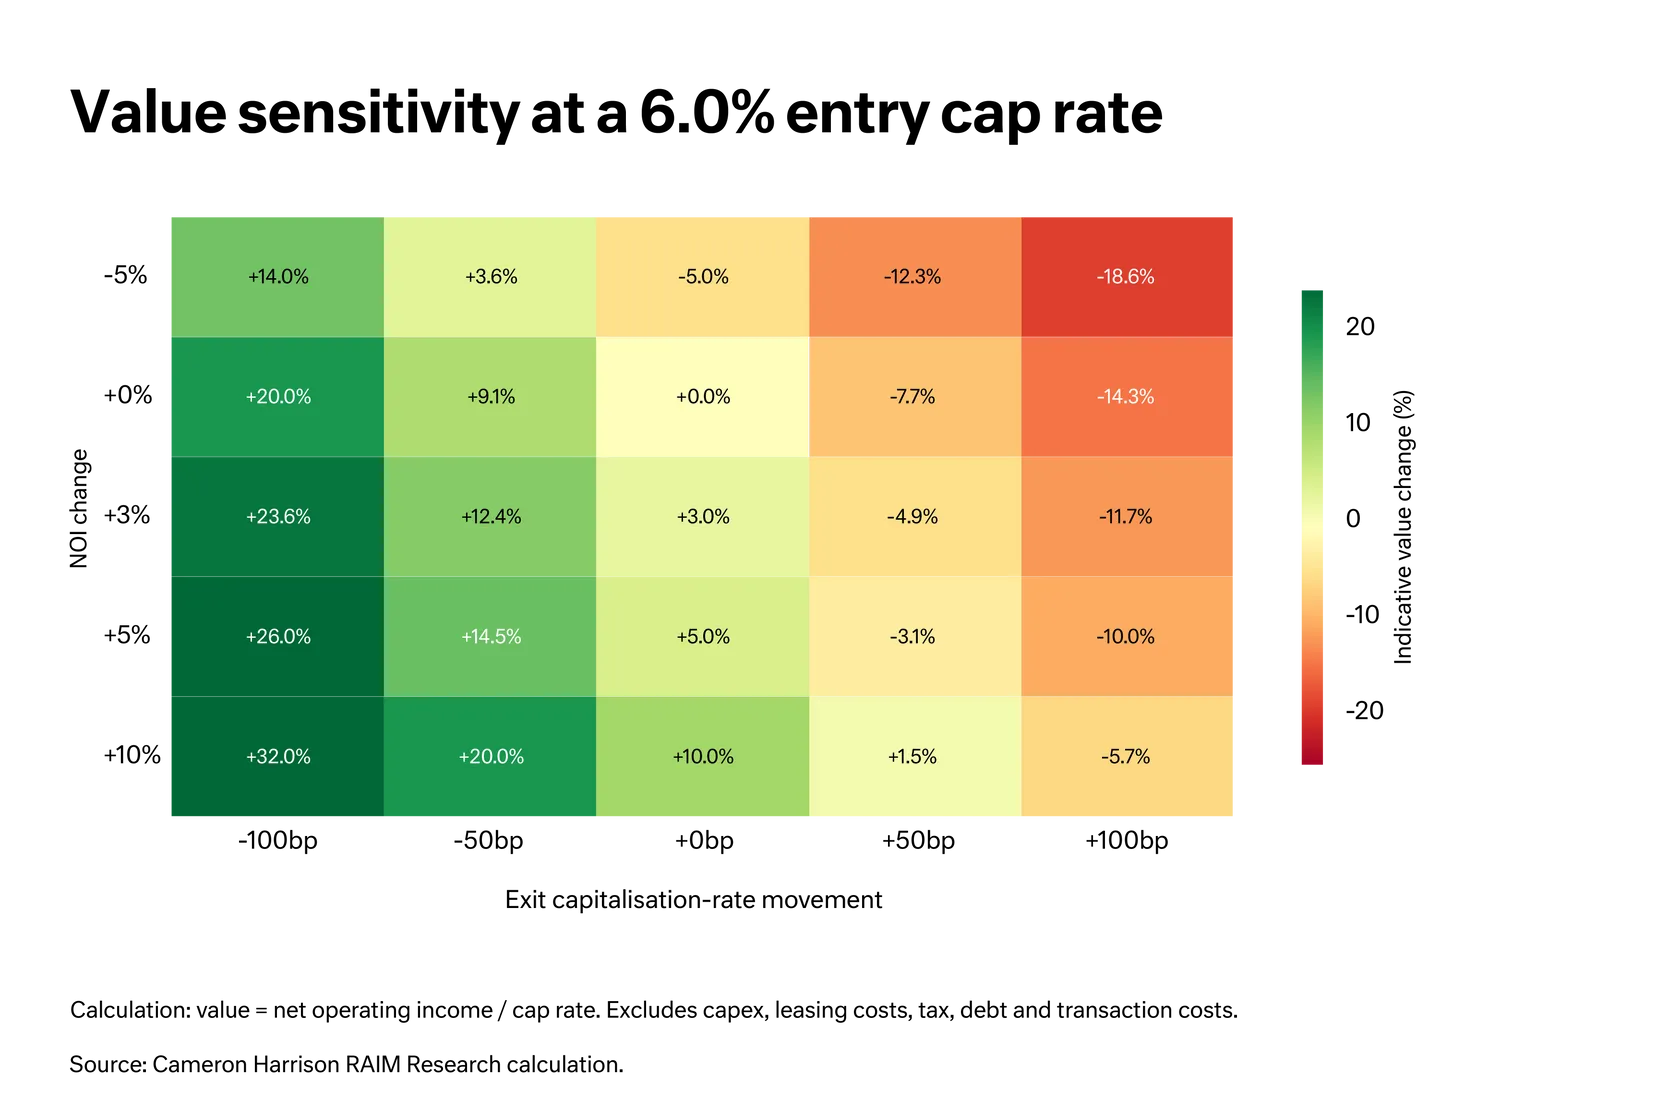
The cap-rate sensitivity analysis below makes the arithmetic clear. For an asset acquired on a 6% capitalisation rate, a 50-basis-point outward movement reduces value by approximately 7.7%, and a 100-basis-point movement by 14.3%, before any change in income. Even 3% growth in net operating income offsets only part of the decline. 

Table - Value sensitivity

Figure 2. Even modest cap-rate expansion can outweigh several years of net operating income growth. 

This is why the base case should not be: rates fall, cap rates compress, values rise. 

Falling cash rates do not guarantee lower long-term bond yields or cheaper fixed-rate debt. Investors relying on cap-rate compression are making two forecasts at once: that inflation falls, and that long-term capital markets respond favourably. 

June-quarter producer prices, up a broad-based 3.6% over the year, show why the first forecast is not yet safe. Cost pressure of that breadth sits uncomfortably with the rapid disinflation some property pricing assumes. 

Neither forecast should be required for an asset to meet its hurdle. 

Australia's housing shortage is both substantial and highly uneven. 

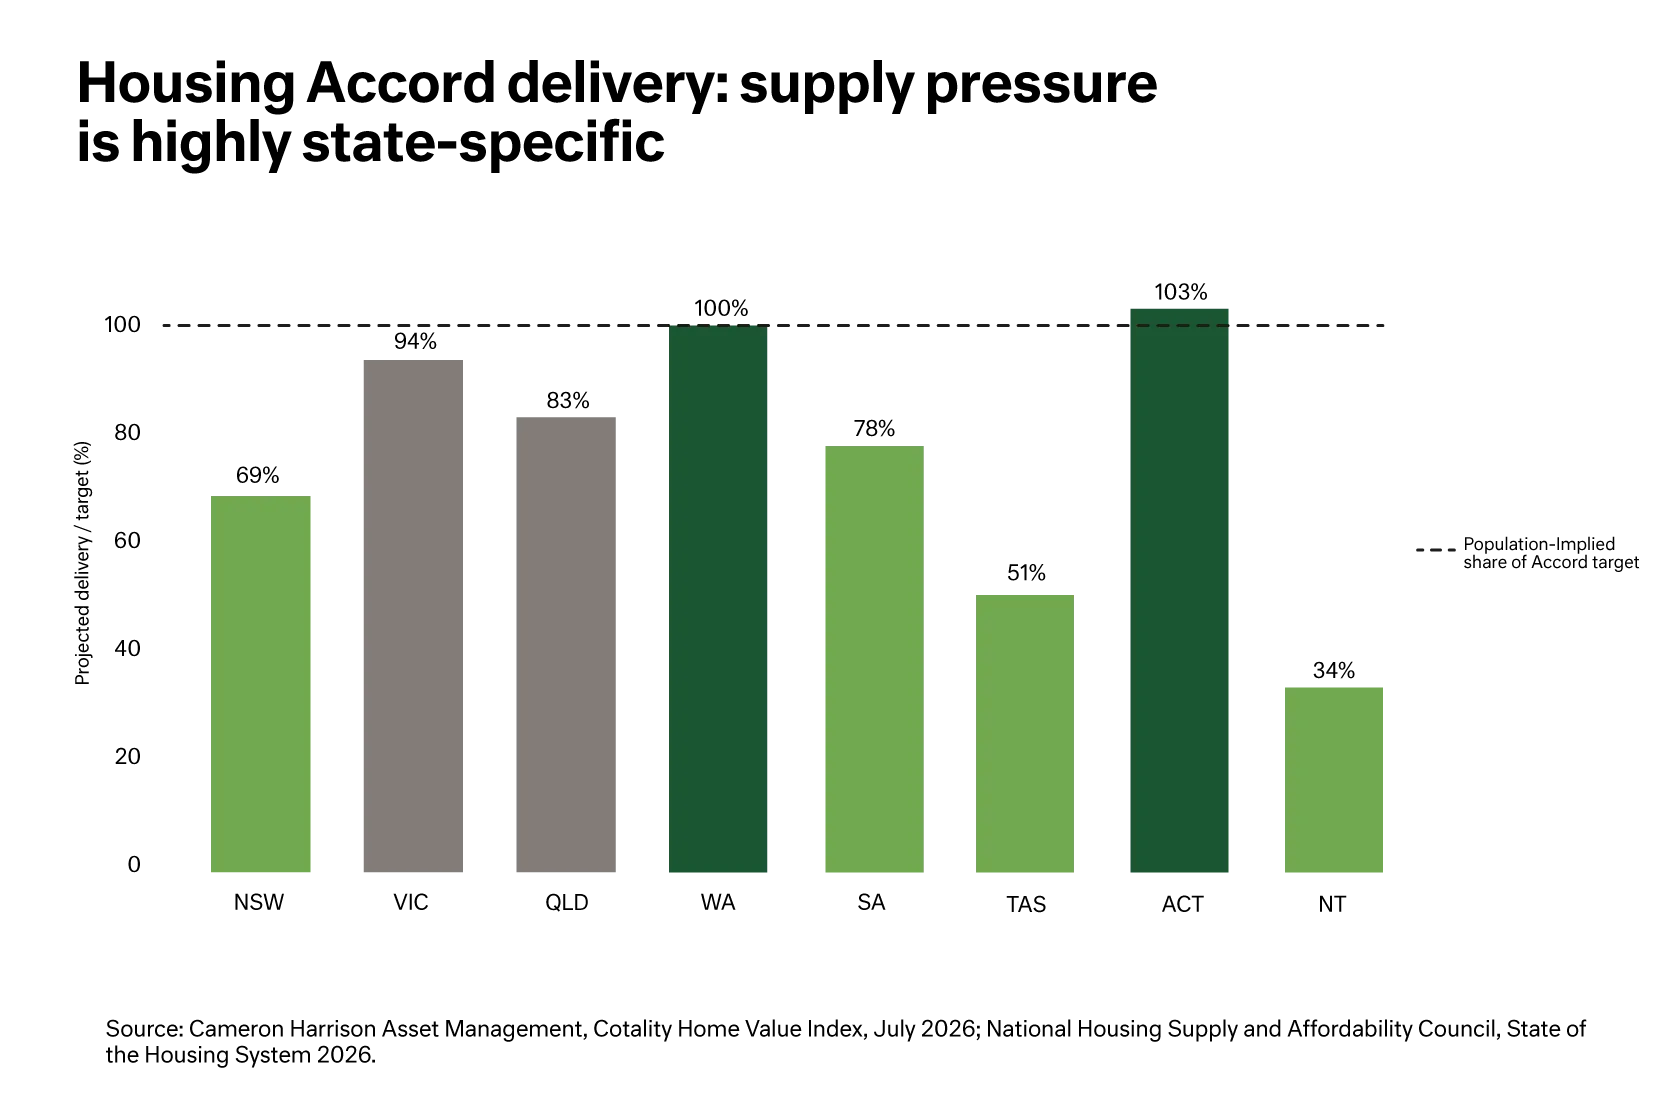
The National Housing Supply and Affordability Council's base case projects approximately 980,000 gross new homes over the Housing Accord period – around 220,000 below the 1.2 million target, with State delivery ranging from roughly a third of population-implied requirements in the Northern Territory to around parity in Western Australia and the ACT. 

Yet national home values fell 0.7% in July 2026. Sydney declined 1.4%, Melbourne 1.2% and Brisbane 0.6%, while Perth remained marginally positive. It was the sharpest monthly fall since December 2022 and is broadening, with high-value Sydney and Melbourne houses leading the declines. National prices sit around 2% below their peak, Sydney and Melbourne roughly 5.5%, with a further 1-2 percentage points of downside now flagged. 

There is no contradiction here. Supply influences long-term rents, replacement cost and scarcity. Borrowing capacity, affordability, tax and credit determine what the marginal buyer can pay today. 

Construction costs sharpen that distinction: inputs into house construction rose 2.1% in the June quarter and builders' output prices 2.0%, so established prices are falling even as the cost of replacing the stock rises. Replacement cost is a slow anchor – it underpins values over time, but it does not fund the marginal buyer today. 

Nor is supply behaving as the cycle would normally dictate. Dwelling approvals rose 7.2% in June to be 9% higher over the year, the strongest financial year since the HomeBuilder scheme inflated 2020-21, despite falling prices, dearer materials and elevated rates, with government housing targets supporting a stronger pipeline than the macro backdrop alone would deliver. Alongside a record non-residential building boom, the construction sector is operating at or above capacity, keeping cost-push pressure alive. 

Bar chart- Housing delivery per state

Figure 3. A cyclical housing correction can coexist with a structural and highly uneven supply shortfall. 

Some forecasters expect prices to stabilise later this year on mortgage competition and shrinking listings. Treat that case with care: withheld listings support prices only while owners can afford to wait, thin turnover degrades price discovery, and forecasters were two percentage points too optimistic only three months ago. The cycle, not the shortage, still holds the pen. 

As discussed in our earlier Australian residential property outlook, housing has a dual role: it is both shelter and an investment asset. That makes its policy settings, valuation and social consequences unusually intertwined. 

For luxury property owners, one further distinction matters. A luxury house is principally an investment in scarce land, privacy and lifestyle utility; a luxury apartment rests on its building platform, protected views, service and shared governance, where strata costs, defects and future tower supply can matter as much as the apartment itself. 

Listing scarcity should not be confused with buyer depth. At the trophy end, transaction evidence is thin, marketing periods can be long and bespoke improvements may not be recoverable, and in the current downturn, high-value Sydney and Melbourne houses are leading the declines while low-value dwellings have yet to fall. Buyer depth thins first at the top.

Our earlier commercial property analysis identified industrial and logistics, selected retail and data centres as important structural themes, while emphasising the continued divergence within office. The August evidence reinforces that direction, but current pricing requires greater discipline. 

Industrial remains Australia's strongest conventional commercial property sector. National vacancy was approximately 3.2% to 3.6%, supported by population growth, e-commerce and supply-chain resilience. 

It is not, however, a cheap sector. 

The indicative super-prime industrial yield was approximately 6.1%, only around 116 basis points above the 10-year Commonwealth yield. At that spread, investors are being paid primarily for future rent growth and asset management – not simply for accepting illiquidity. 

The more attractive assets have identifiable advantages: below-market rents, near-term reviews, infill land, power capacity or the ability to subdivide and intensify. 

Retail has moved from a structural short to a more credible income-growth allocation. 

Neighbourhood centres and large-format retail offer exposure to essential spending, low vacancy, relatively manageable occupancy costs and redevelopment optionality. Well-located assets can grow income through tenant remixing, services and surplus-land development. 

The discipline is not to confuse defensive tenants with defensive pricing. 

A supermarket-anchored centre acquired at a yield only modestly above government bonds can still disappoint if rent reviews lag inflation, capital expenditure is underfunded or the anchor tenant controls the redevelopment pathway. 

Purpose-built student accommodation, land-lease communities and selected build-to-rent assets benefit from structural demand. Yet each is partly an operating business. 

Revenue is not rent alone: staffing, marketing, utilities and turnover determine how much gross revenue becomes net operating income. 

The same principle applies to data centres: the investable scarcity is not generic industrial land with an "AI" label, but secured power, connection readiness, fibre, cooling and credible operators and customers. 

Property investors should not pay data-centre land values for a site that may wait years for grid capacity. 

Data-centre approvals are at record highs, with build-out investment estimated to exceed $150 billion, the same pipeline that is pushing construction beyond capacity and raising build costs across property. 

Office is investable, but the opportunity is not the average building - the preferred strategy is a barbell. National CBD vacancy was 15.9% in January 2026, with Melbourne at approximately 20.5%; beneath those aggregates, tenants continue to favour modern, efficient, well-located buildings. 

At one end sit scarce premium Sydney and Brisbane assets with tenant depth and genuine rental power; at the other, deeply repriced Melbourne assets where the acquisition basis is low, competing supply is limited and the capital plan is fully funded. 

Between them sits a large group of secondary assets where the high yield may simply be compensation for structural vacancy, incentives, energy upgrades and lender haircuts. 

A low purchase price is not necessarily value. It may be deferred capital expenditure. 

The 2026 Federal residential reforms create an important divide between established residential property held before the announced grandfathering cut-off and property acquired later. 

Under the announced framework, from 1 July 2027 deductions associated with newly acquired established residential property will generally be quarantined against residential income and gains rather than deducted against salary or unrelated income. Newly built residential property receives different treatment, while qualifying established property acquired before 7:30pm on 12 May 2026 is grandfathered. 

Grandfathering is an attribute of the current owner, not of property quality. A weak asset should not be retained solely for favourable tax treatment that may not transfer to the next purchaser. 

State taxes can be equally consequential. As explored in our analysis of Australia's property taxes, duty, land tax, foreign-purchaser surcharges, vacancy taxes and rezoning charges can materially change investor outcomes and buyer depth. 

The valuation effect can be substantial. At a 6% capitalisation rate, an additional $50,000 of recurring, unrecoverable annual tax represents approximately $833,000 of value before allowing for future growth in the tax. 

A 25-basis-point advantage in the purchase yield can therefore be overwhelmed by ownership structure, residency status or State jurisdiction. 

The correct structure cannot be selected from the cap rate alone: income tax, capital gains tax, land-tax aggregation, succession, borrowing capacity and the likely exit route need to be modelled together. 

A high-quality asset can become a poor investment when held through a leveraged, fee-heavy or illiquid structure. 

Our strategies do not typically own investment property directly. Exposure is gained through liquid, listed and occasionally managed vehicles – which makes the choice of manager, mandate, fees and structure as consequential as the choice of underlying asset. Liquid vehicles also make tactical asset allocation decisions more efficient to implement – shifts are timely and cost-effective, and the benefits of the decision flow through to the portfolio immediately. 

Private syndicates and funds provide access to larger assets and specialist management, but introduce fee layers, valuation lag, capital calls, extension risk and potential conflicts. A stable unit price is not proof of stable economic value; it may simply reflect infrequent valuations. 

Listed A-REITs provide liquidity and real-time price discovery, but they also transmit long-bond movements quickly. The A-REIT index fell about 16% in the March 2026 quarter, then rebounded as bond yields eased. 

Figure 4. Listed property reprices long-bond risk faster than private valuations. 

Senior property credit may offer attractive income and downside priority, but the stated loan-to-value ratio matters less than where the lender attaches under a stressed, executable value: a 65% loan against an optimistic development valuation can be riskier than an 80% loan against a completed, liquid asset with genuine buyer depth. 

For significant wealth owners, property should therefore sit within a deliberate asset allocation, rather than being accumulated asset by asset without reference to the rest of the investor's balance sheet. 

1. Count the whole property balance sheet

lifestyle, business and portfolio. The residence and holiday house, business premises, and arm's-length portfolio holdings such as fund units, syndicate interests and listed property all contribute to concentration, even though only the portfolio is typically labelled an investment. 

2. Separate the sources of return, particularly luxury, high-end property

financial income, private consumption and option value should be recorded independently. A home enjoyed as a lifestyle asset and simultaneously counted as a strong investment is being credited twice for the same benefit.

3. Protect liquidity before adding illiquidity

debt maturities, tax, capital calls and undrawn fund commitments should be mapped under a downside case. Our portfolio framework calls for liquidity sufficient to cover at least 24 months of these requirements, without assuming a directly held property can be sold quickly. 

4. Stress the exit rather than validating the entry

we test how each holding would fare under 50, 100 and 150 basis points of cap-rate expansion, lower income, longer vacancy and rising debt costs, and size positions so a listed drawdown never forces a sale at the bottom. For unlisted allocations, the exit itself is the test: redemption terms, fund expiry and extension risk.

The preferred opportunities are assets that combine scarce land or infrastructure with an ability to reset income. At the portfolio level, our mid-2026 asset allocation review holds listed property at neutral – around 14% of a Moderate portfolio – with elevated real yields capping valuations, but real-asset income, occupancy above 95%, mid-single-digit re-leasing spreads and discounts to net tangible assets underpinning the hold. 

Within the listed allocation, we favour conservatively geared vehicles with minimal office exposure, tilted to industrial and essential retail. A tilt that cushioned the real-yield shock in the first half of 2026. 

Data centres remain a selective infrastructure theme, listed names have been marked down hardest on execution risk. Hotels and agriculture can diversify, but both introduce operational, commodity or climate exposure and require specialist management. 

Listed property is the core of our property allocation. Its daily liquidity and real-time pricing, together with a deliberate cash reserve, allow patient capital to respond when refinancing, fund expiry, succession or capital-expenditure pressure creates motivated sellers. On our long-run assumptions, listed property offers an expected 7-8% per annum over the decade, roughly 6% income and 2% growth, and the stance is formally reviewed if the 10-year Commonwealth yield moves above 5.5% or below 4.0%. 

The greatest risks are paying bond-like yields for property-like liabilities, assuming favourable tax treatment will transfer to the next buyer and treating structural housing undersupply as protection against cyclical repricing.  

1. Is Australian property still attractive in 2026?

Australian property remains investable, but not as a single broad market trade. The stronger opportunities are assets with visible income growth, genuine land or infrastructure scarcity, manageable capital expenditure and conservative leverage. Low-yield property dependent on falling interest rates or cap-rate compression offers a less reliable margin of safety while long-term government bond yields remain elevated. 

2. How should HNW and UHNW investors approach property allocation?

Property should be assessed as part of the investor's total balance sheet: lifestyle property (the home and holiday house), business premises, and portfolio exposure held through listed vehicles, funds, syndicates and property-backed credit. The allocation should account for income needs, tax structure, debt maturities, capital calls, succession and exit liquidity. A portfolio anchored in listed property is not dependent on selling one large asset at the wrong time. 

3. How do the 2026 Federal residential tax reforms affect property investors?

From 1 July 2027, deductions on newly acquired established residential property will generally be quarantined against residential income and gains rather than offset against salary or unrelated income. Qualifying established property acquired before 7:30pm on 12 May 2026 is grandfathered, and newly built property is treated differently. Grandfathering attaches to the current owner, not the property, so favourable treatment may not transfer to the next buyer. The valuation effect can be substantial: at a 6% capitalisation rate, an additional $50,000 of recurring, unrecoverable annual tax represents approximately $833,000 of value, before allowing for future growth in the tax. Tax should be a filter, not the investment thesis. 

Speak to one of our advisers to learn more: paul.ashworth@cameronharrison.com.au