This article is a transcript of a webinar held by Cameron Harrison on 2nd September 2020.
— Watch the recorded session here.
— Download the presentation here.

This article is a transcript of a webinar held by Cameron Harrison on 2nd September 2020.
— Watch the recorded session here.
— Download the presentation here.
Cameron Harrison's approach to asset allocation is a combination of traditional allocation between the asset classes of equities, fixed income, real assets, property and cash which draws from an analysis of various factors. Some of these factors are:
— Credit spreads
— Political
— Liquidity
— Inflation expectations
— Currency
— Market risk
— Macroeconomic policy and settings
These factors measured against the relative opportunity between the basket of asset allocation choices drive our balance of risk assessments and allocation between various asset classes and sub classes.
Asset Allocation Strategy
Short-term and Long-term
What we have in the below table is a summary of our asset allocation outlook divided between:
— Short-term through to the end of 2022, which will be a reasonable expectation in terms of addressing the health and economic impact and consequences of COVID, and
— The longer-term outlook for asset classes based on a post-COVID position through to 2029.
We have put that into colour coding in terms of the core asset class alternatives. We also have a more specific breakdown within those asset classes in terms of currencies, different types of property, different types of bonds, yields and geographies of equities which is available by contacting us.
What is most noticeable is the green shaded areas, the Equities and Commercial Property - and we are well disposed to both of those asset classes particularly as the global economy rebounds.
This reflects our view that output will recover and get near to its pre-COVID growth rate, but it won't be a straight line, and there'll be fits and bursts. This ought to be contrasted to our view on bonds and cash rates, which are being deliberately suppressed by government policy and face upside risks to yields and hence capital prices. And the final thing I'd like to note is that in terms of commodities, we are reasonably positive on commodities and commodity related companies in the short run, particularly as they are tied to government stimulus around the world, but most notably in China but when we look at this from 2022 onwards we have a more muted relative position which reflects the easing of stimulus.
The degree of muteness in our assessment of asset classes from 2022 onwards is across the board. We think this is important to note because these muted assessments are really synonymous with an expectation for lower nominal returns for investors and secondly, that from a real return perspective that is adjusted for inflation, the risk of increased inflation will be to the upside which will dampen real returns.
Beyond the Asteroid Hit
A key foundation to the framing of our asset allocation relative positions over the short and long term is what the output recovery will look like post the COVID asteroid hit. It is clear there has been a material impact to output, but also that is not unparalleled from a historical perspective - where we've seen recessions, depressions, financial crises and most recently the GFC. This initial COVID output loss will largely be a permanent output loss and hence won't be recovered. That's in the form of lost consumption from leisure, restaurants to travel and plain out cancellation of investment and consumption. That said, our view as matters currently sit and looking forward is that output will recover and then return to near or at its previous growth rate, which in itself was not overly stretched coming into the COVID health crisis.
The factors that determine what this output recovery’s trajectory will be are:
The capital stock, how the capital stock is utilized and to what extent any of it is made redundant.
The labour force and the extent of unemployment and underemployment.
How both the factors of capital and labour come together to efficiently operate and optimize output.
You can see our view is reflected in the light green line (Figure 3) and we think that whilst this is stylized and not going to be a straight line, the conditions exist for growth to revert to a reasonable growth rate trajectory over the next 2 to 5 years. Importantly, we consider that the capital stock and labour have remained in reasonable condition because we have not had a financial or banking crisis.
The extent of the recovery in output and its growth rate is significant for asset allocation setting moving forward. We want to briefly touch on some historical reference events to compare past crises to our current circumstances and to see how output recovered taking account of the three factors of capital stock, labour market preservation and how they effectively coordinated together after the shock. What you will see is that there “aren’t any guaranteed outcomes”.
Output Recovery
Post-GFC for G7 – Poor Outcome
The first example is the GFC which is in all of our recent memories. The GFC and its aftermath is an example of a relatively poor outcome, in terms of the recovery and growth rate for output. This was largely attributable to a slow and probably inadequate response of fiscal policy, and a mixed response by monetary policy other than in the US. What this highlights is the degree by which governments operate austerity in terms of their government spending is very important in terms of how output growth can recover when it's been hit by a shock.
Output Recovery
UK Post-WWI – Poor Outcome
Another poor outcome was Britain immediately after World War I and through the roaring 20’s which largely bypassed Britain. This was an example of where government instituted austerity and anaemic fiscal support for the economy, imposed tariffs and protection which lessened competition and innovation within the economy, which all combined with a change in Britain's world market share in terms of key commodities and trade items. As we can see from 1915-1950, Britain never recovered to the growth trajectory that it was pre-World War I.
Output Recovery
US Great Depression – Optimism
Encouragingly, both these examples can be contrasted to the Great Depression in the US. What we can see here is that once government spending started to loosen - from 1933 - and monetary conditions became more supportive, output started to improve and unemployment reduced from a high of 25% in 1933 to a little under 10% prior to the beginning of World War II in 1941.
From these examples we can see that where there has been a significant economic shock, the role of expansionary government spending together with supportive monetary policy is foremost to restoring growth in output. If this does not occur, or is curtailed too early, then like the recent experience of the GFC, particularly in Europe, we can expect output growth to be sub-optimal. The COVID response and the greater understanding by policy makers of past crises suggests lessons have been learnt from the past and a reasonable basis for output to grow at rates prior to COVID exists. Conversely, were this to prematurely cease before output growth stabilized, then this would be reason for significant caution and our assessment would naturally change.
Output Recovery
Capital Stock & Labour Markets – Optimism
At this stage, we don’t foresee significant destruction of capital stock but do acknowledge that for industries like aviation there may be some permanent destruction. However, this is small in the context of the overall capital stock. This is a significant positive, supporting future output growth rates.
In terms of labour and employment, you can see where consensus estimates sit, from peak unemployment over the next few months there is likely to be a substantial fall in unemployment from mid next year moving to levels well below 10%, from 2022 onwards. This is also consistent with outcomes in China. This is also supportive of future output growth rates.
Output Recovery
Australia – Net Migration
In terms of labour, Australia has had world-leading net migration for the last five years. This has boosted economic growth, added to government tax revenue and significantly increased the size of the working age population compared to the population over 60 years of age. If this were to be curtailed, then this would adversely impact economic growth in Australia compared with the pre-COVID period.
In our previous webinar Global Equity Strategy - FAANG it or not?, we provided our views on global equities, specifically in context to the preoccupation with a handful of named tech companies.
We noted that exposure to profitable well run technology and innovation is being ignored by the marketplace which is fixated and preoccupied with this small group. On the basis that we see a recovery in output and a reasonable trajectory in output growth rates, we restate our preference for quality dynamically-conducted businesses that represent reasonable value - averaging between 17 to 18 times cyclically adjusted PE earnings. We can see the relative underperformance of the US Equity market ex Big Tech or the FAANGS.
The same theme is true in Australia if perhaps on a somewhat weaker basis due to Australia's high level of household debt, and consequently constraint on consumption and investment moving forward.
In terms of listed property or REITS both here and in the United States, we find this class attractively positioned particularly relative to the equities recovery over the last two months. From an Australian context we are:
Long positioned in logistics, industrial office and fringe CBD invested on long weighted average lease expiries or in shorthand, WALES of over 6 years
Exposure to investment grade and government tenants
Gearing at 30% or lower with long debt expiry duration
Negligible COVID rent adjustment
Generating 6.5%-7% pa prospective yields.
This sees a relative upshift in property at the expense of fixed income.
The comments last week by Federal Reserve Chairman, Jerome Powell, supporting a higher than target level of inflation being allowed to exist is supportive of the strong operational businesses that we have within the Cameron Harrison global equity and Australian equity strategies.
Against an upward inflation risk bias, medium to long term government bonds face upward yield pressure and as a result, pressure on their capital prices which over the last 30 years have benefited from the compression in bond rates and capital price appreciation. Accordingly, we favour exposure to financially secure corporate credit with low duration risk.
It is akin to rubbing a “crystal-ball” and the path over the next 9 years will be far from steady or smooth. What it does clearly show is that the 30-year bull market in bonds and fixed rate securities without any inflation hedge is over. As we have consistently commented on over the last few years – the journey ahead is not simply a set and forget passive path dictated by every compressing bond rates. That chapter has concluded, we return to more uncorrelated outcomes amongst asset classes. Asset allocation will require greater attention and a more dynamic approach by investors.
Wealth Strategy Process
A client’s success or otherwise in achieving their wealth goals is highly dependent on the investment strategy chosen, and in particular, asset allocation strategy. Our role as advisers is to assist clients through this process, which is always specific and appropriate to their individual position. The setting of asset allocation is a core element of wealth strategy, and flows from a clear, well considered framework of objectives. We advocate regular review of objectives, rather than the set and forget trap many unknowingly fall into.
When Should a Client Review Objectives and Asset Allocation?
When engaging us for the first time, this investment strategy setting is the first decision we will ask them to make.
They may have experienced some form of capital realisation event, such as the sale of a business or significant asset.
Conversely, they may have committed some of their existing funds to another opportunity, such as the purchase of a property, and need to rebalance their portfolio to accommodate this change in investment exposure.
Life – as we know all too well from the past six months – throws curveballs and our work, family or funding circumstances change.
Economic circumstances change. For example, perhaps the client’s priority is for income and low interest rates warrant a move toward higher-earning asset classes.
Or maybe an uncontrollable influence has tested their existing strategy and proven it to be at-odds with their true, underlying risk tolerance.
Certainly, the last two reasons for needing to revisit investment strategy are highly relevant in the current COVID environment and is the most common reason why clients have asked us over the past few months “is my strategy still right for me, or should I be doing something else”.
Regardless of the reason why a client would need to revisit their strategy and asset allocation, we take them through our strategy review process. The process itself is quite structured, but of course the outcomes are different from one client to the next.
Let us briefly take you through our approach to client strategy, using Michael and Michelle as our case study.
We start first with their current financial position – their assets, liabilities, income and expenses. Our approach to asset allocation is needs- or objectives-based, meaning we seek to balance the client’s strategy to what they need at a core level. Often, we find the question “how much do you need to live off” is the most difficult question for clients to answer but through a number of questioning techniques, we listen and probe until we get to a realistic figure. It’s why the investment strategy process is equal parts analytical as it is behavioural.
In Michael and Michelle’s case, they are in their late 40’s and their commitment to school fees is coming to an end. They are earning more than they need to meet their expenses, so they have no need for income from their investment portfolio and consequently have accumulated $3.5m of net investment assets to date, which is currently invested to our Core strategy of 50% exposure to market risk assets.
We now know who they are, but what are they about?
What is important to them?
To be able to construct a strategy with purpose, we need to understand what their priorities are, and to do this, we ask each of Michael and Michelle to identify their three most important objectives, which today are:
Increase our wealth over the next 15 years before we retire
More travel while the children are still happy and able to holiday with us
Support the children through tertiary education and if we can, give them a boost with their first property
Before we can advise Michael and Michelle on a specific investment strategy, we need to truly understand what drives them. In other words, understand their psychology. If we don’t get this fundamental understanding, we find it inevitably leads to misaligned expectations. Here we consider:
— Their capacity to take on risk
— Their willingness to take on risk, and
— Their behavioural and emotional influences (for example, a client may say they are willing to take on risk but get anxious when markets fall, which indicates overconfidence in their personal risk assessment).
Questions we might ask Michael and Michelle in understanding their respective and joint profile would be:
— Are you seeking capital growth, capital preservation or income?
— Would you prefer that your portfolio grew at say 6%-8% with a degree of consistency, or at a higher level with a higher chance of a low or negative return?
— When markets go down, would you prefer to sell some of your riskier assets (shares) and put the funds in lower risk assets (cash)?
— Do negative short-term movements in asset prices significantly influence your ability to stay exposed to those assets?
We’re now starting to form a picture about their risk profile. We know the traditional risk/return trade-off would likely require more risk to be taken in order to achieve higher returns, so we start with the base risk-free position and move up that curve until we meet an asset allocation that satisfies both their risk and return parameters. Importantly we consider, if an investor could achieve their core objective through say inflation-linked government bonds, why should they take on any more risk?
In the CH asset allocation suite, Interest-Bearing Securities is our base position.

Now, for Michael and Michelle, they have both a capacity and willingness to take on risk. Capacity in the sense that they have stable income from other sources that meets their expenditure without drawing on their existing capital. Willingness in the sense that they want to accumulate more wealth for their retirement which is at least 15 years away and they therefore have a sufficiently long investment horizon to accept some variability in returns. We note that Michael and Michelle’s existing Core strategy of 50% market risk assets is too conservative relative to their current risk profile and objectives, so we consider a move ‘up the curve’ to either Moderate (60% market risk) or Growth (70% market risk).
Technology is a powerful aid here and we have developed our own portfolio modelling software to add science to this process. The Cameron Harrison Asset Allocation Tool is a client-driven and interactive tool to simulate potential future outcomes for a range of variables. This was custom-built by us in conjunction with a New York-based software designer who has worked with the World Health Organisation on dynamic modelling. And we are pleased to share this with you today.
Simulating Michael and Michelle’s options with the tool, we enter their key input assumptions (a portfolio value of $3.5m and timeframe of 20 years until likely retirement) and then set up two investment scenarios:
Scenario A, being the Moderate, and
Scenario B, Growth.
The tool then runs what is a called a Monte Carlo simulation which involves 1000 simulations over the 20-year timeframe. The result is shown in the chart on the right. The green line is scenario A (the Moderate strategy) versus the grey line (scenario B) for Growth. Not surprisingly, the Growth strategy produces a higher future portfolio value than the Moderate.
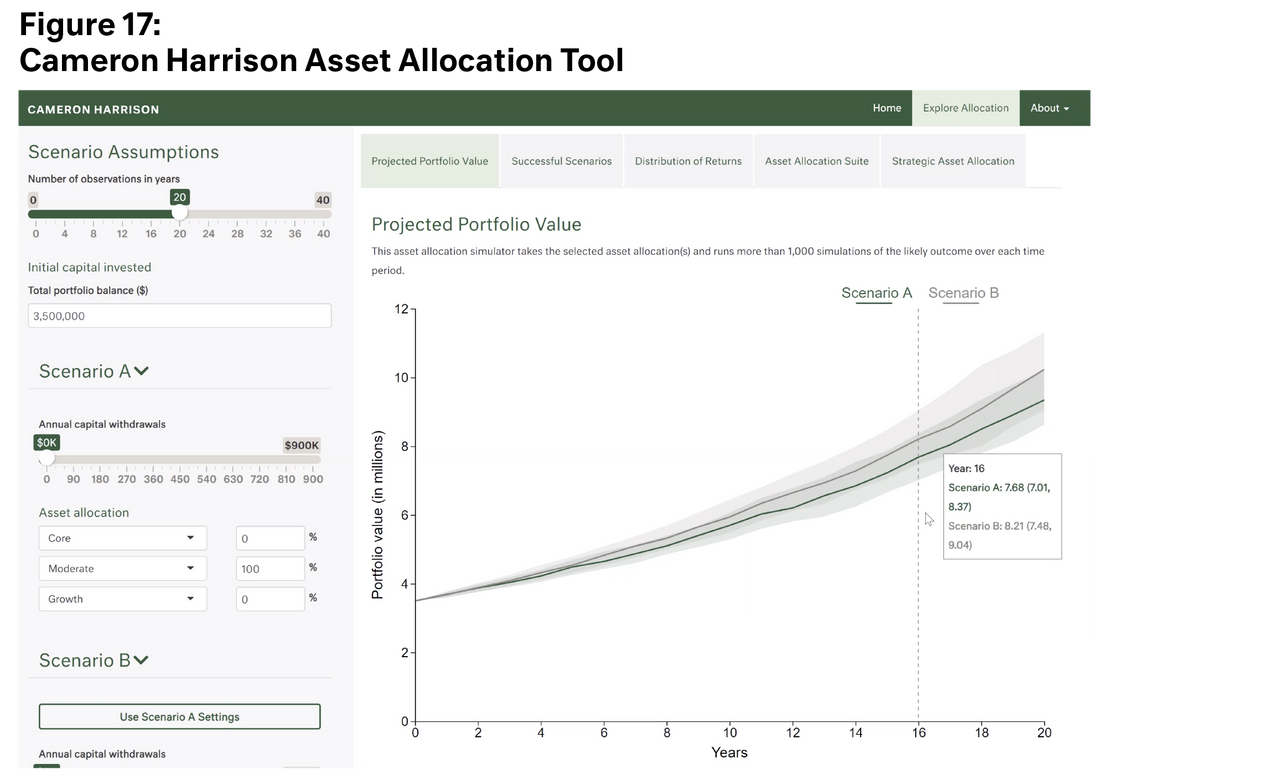
Of course, return is not the only factor. The variability of returns should also be expected to increase with return, and this is shown by the shaded areas around the lines. The lines themselves show the most likely portfolio value for the simulations run, whereas the shaded areas show the range of possible values. You can see from the chart that the higher-risk Growth strategy (the grey shading) has a larger range of possible outcomes than the green Moderate strategy, indicating the additional variability or risk associated with higher growth. This variability becomes more pronounced the longer the investment timeframe.
Now, what about those inevitable – but often ignored – troughs. How would Michael and Michelle react if their portfolio didn’t always go up? Loss frequency is the chance of a negative return in any 20-year period. For the Moderate strategy, the loss frequency is 3 years in every 20 years. For Growth, it is 4 years in every 20.
Armed with all that information and with the benefit of visual simulation of possible outcomes, Michael and Michelle understand the balance of risks and the higher chance of experiencing a negative return frequency. Consulting with us, they opted for the Growth strategy. But, as is our diligent and disciplined way, we navigate this move on a staggered basis and advise them to first move from Core to Moderate, increasing market risk by 10%, over the next 10 months. Then, we reassess, perhaps remodel and if the environment and their circumstances continue to support it, we embark on the next move to Growth.

Asset allocation strategy and its integration to client strategy outcomes is Cameron Harrison’s central activity and focus. We thank you for your time this afternoon, and trust that you have found the research and how we bring to life for clients’ interest and value. Above all, it is a constant, reiterative process – there is no set and forget.
Cameron Harrison have been advising business owners and their families on asset allocation and intergenerational wealth management for over 50 years. We have demonstrated over a long period our ability to manage investments through both the good times and bad by keeping the client at the centre of our business.
For more information on our approach to investment strategy or any other inquiries, please contact us on +613 9655 5000.
Sourced from:
Photo by Jessy Smith, on Unspalsh